Color - TCS34725
RGB Color Sensor with IR filter and White LED
Plugin details
Type: Color
Name: TCS34725
Status ESP32: COLLECTION
Status ESP8266: COLLECTION
GitHub: P050_TCS34725.ino
Maintainer: TD-er, tonhuisman (code), heinemannj (docs)
Used libraries: https://github.com/adafruit/Adafruit_TCS34725 (local copy)
TCS34725

Introduction
The TCS34725 has RGB and Clear light sensing elements. An IR blocking filter, integrated on-chip and localized to the color sensing photodiodes, minimizes the IR spectral component of the incoming light and allows accurately color measurements.
Specifications:
RGB color and light sensor with 4 channel light sensing readings (Red, Green, Blue, Clear)
Calculated light lux
Calculated color temperature
Adjustable integration time and gain
Neutral 4150 °K temperature onboard LED to illuminate what you’re trying to sense
I2C 7-bit address (0x29) - fixed
I2C pins can be used at 3.3V or 5V
Wiring
ESP                  TCS34725
GPIO-4 (D2)   <-->   SDA
GPIO-5 (D1)   <-->   SCL

Power
3.3V          <-->   3.3V
GND           <-->   GND
The onboard LED can be turn off by pulling the sensor LED pin to LOW:
To turn off permanently: Wire the sensor LED pin directly to the microcontroller ground
ESP                  TCS34725
GND           <-->   LED
To control via an ESPEasy switch: Wire the sensor LED pin to a spare microcontroller digital pin
ESP                  TCS34725
GPIO-12 (D6)  <-->   LED
To control with setInterrupt(): Wire the sensor LED pin to the sensor INT pin
TCS34725             TCS34725
INT           <-->   LED
Setup
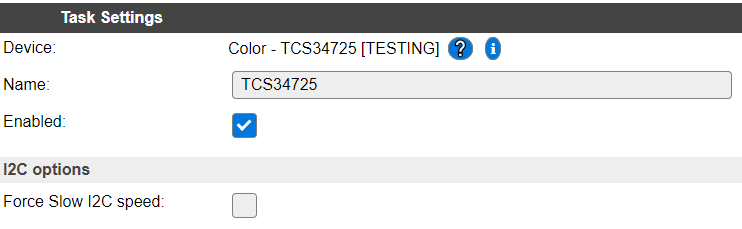
Note
I2C address: 0x29 Can not be changed
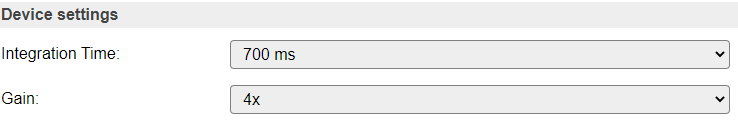
Gain and Integration Time
The Integration Time of the sensor must be a value between 2.4-700 (in milliseconds)
The gain of the sensor must be a value of 1, 4, 16, 60
In general:
Use the minimum Gain as possible, since increasing the Gain amplifies the noise as well as the signal
Choose an Integeration Time long enough to produce a near full-scale value, since this will give you the most effective use of the sensor’s resolution
To adjust Gain and Integration Time settings:
Switch to Raw RGB data plus the Clear channel
Set Gain to 1
Increase Integration Time until the Clear Channel value reach 65535 (maximum value) => Sensor is saturated
Decrease Integration Time by one level => All channels MUST < 65535
Control that Color Temperature (DN40) value of daylight is not 0
After applying transformation/calibration factors do NOT change your settings of Gain and Integration Time (see chapter “Conditions”)!
Output settings
Raw RGB (0..65535)
Raw RGB (0..65535) transformed (3x3 matrix, below)
Normalized RGB (0-255)
Normalized RGB (0-255) transformed (3x3 matrix, below)
Normalized RGB (0.0000..1.0000)
Normalized RGB (0.0000..1.0000) transformed (3x3 matrix, below)
Color Temperature (DN25 - deprecated) [K]
Color Temperature (DN40) [K]
Ambient Light [Lux]
Clear Channel
For detailed explanations see below chapter “Indicators (recommended settings)”.
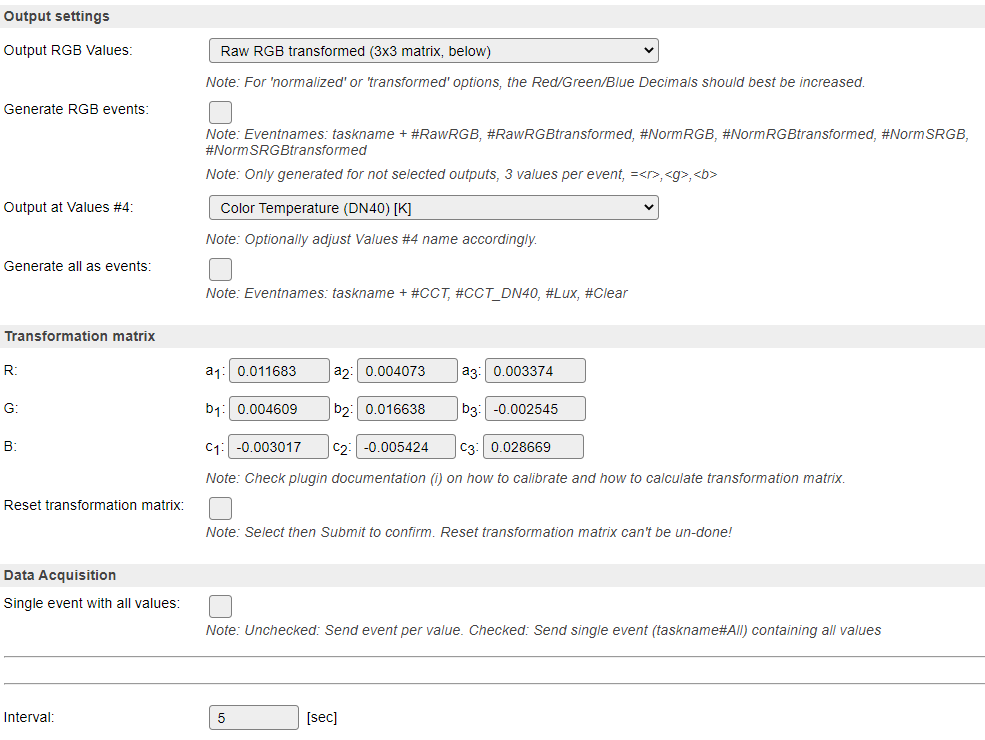
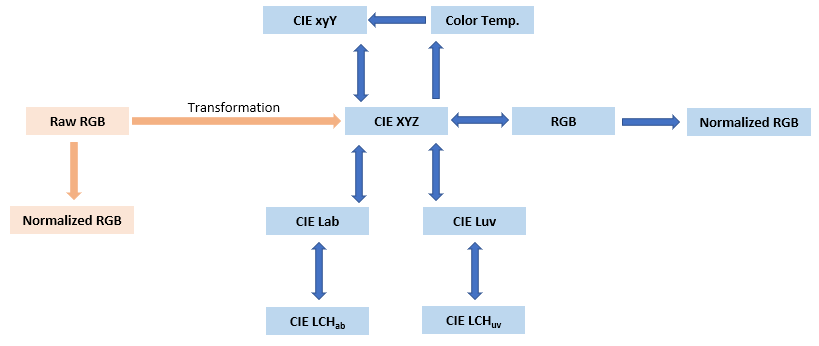
Transformation matrix
Example for a Transformation into the CIE-XYZ color space:
Most common and most accurate approach
| X* |                                | R‘ |
| Y* |        =       | M |   *       | G‘ |
| Z* |                                | B‘ |

- X*, Y* and Z* are the estimated CIE-XYZ values
- R', G' and B' are the responses from the sensor's Raw RGB output channels
- | M | is the transformation matrix based on your sensor calibration
Conversions from CIE-XYZ color space into RGB (e.g. sRGB, Adobe RGB (1998), …) or other color spaces are easyly to manage (see chapter “Conversions from CIE-XYZ color space into other color spaces”)
The sensor without any kind of calibration can only provide a raw color estimation (see chapter “Normalized RGB”)!
Please follow the chapter “Sensor calibration” to understand the procedure for setting up and to calculate a transformation matrix fitting to your specific need.
After applying transformation/calibration factors do NOT change your settings of Gain and Integration Time (see chapter “Conditions”)!
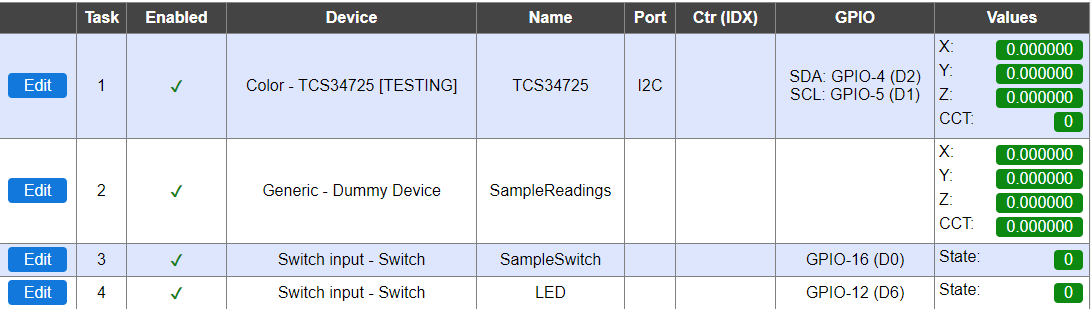
Rules examples
The following example is based on:
a Switch which will start a Sample and will indicate that the Sample is finished
an LED (onboard of your TCS34725 or placed somewhere else in your case) to illuminate what you’re trying to sense
a Dummy Device for the recording of your Sample Readings
a Rule Set for synchronization
On System#Boot do
  Let,1,0                                             // LoopCounter
  Let,3,0                                             // SampleMode off
  Let,5,0                                             // Sample averages
  Let,6,0
  Let,7,0
  Let,10,16                                           // SampleSwitch GPIO
  Let,11,12                                           // LED GPIO
  Pulse,[INT#11],1,1000
endon

on ResetSampleReadings do
  TaskValueSet,%eventvalue1%,1,0                      // SampleReadings
  TaskValueSet,%eventvalue1%,2,0
  TaskValueSet,%eventvalue1%,3,0
endon

on UpdateSampleReadings do
  TaskValueSet,2,%eventvalue1%,%eventvalue2%          // SampleReadings
  if %eventvalue1%=3
    GPIO,[INT#10],0                                   // SampleSwitch off
  endif
endon

on Sample#State=1 do                                  // SampleSwitch on
  GPIO,[INT#11],1                                     // LED on
  asyncevent,ResetSampleReadings=2                    // SampleReadings reset
  Let,3,1                                             // SampleMode on
  TaskRun,1                                           // Sample start
endon

on TCS34725#X do
  if [INT#3]>0                                        // SampleMode on
    Let,1,[INT#1]+1                                   // LoopCounter
    if [INT#1]>1 and [INT#1]<6                        // Skip values for 1. Loop
      Let,5,[VAR#5]+[TCS34725#X]                      // SampleAverages for Loop 2,3,4,5,6
      Let,6,[VAR#6]+[TCS34725#Y]
      Let,7,[VAR#7]+[TCS34725#Z]
    elseif [INT#1]=6
      Let,5,([VAR#5]+[TCS34725#X])/5
      Let,6,([VAR#6]+[TCS34725#Y])/5
      Let,7,([VAR#7]+[TCS34725#Z])/5
      asyncevent,UpdateSampleReadings=1,[VAR#5]       // SampleReadings update
      asyncevent,UpdateSampleReadings=2,[VAR#6]
      asyncevent,UpdateSampleReadings=3,[VAR#7]
      GPIO,[INT#11],0                                 // LED off
      Let,1,0                                         // LoopCounter reset
      Let,5,0                                         // SampleAverage reset
      Let,6,0
      Let,7,0
      Let,3,0                                         // SampleMode off
    endif
    TaskRun,1                                         // Loop
  endif
endon
Indicators (recommended settings)
Indicator |
Value Name |
Range |
Interval |
Decimals |
Extra information |
|---|---|---|---|---|---|
Raw RGB |
|
|
0 |
|
|
Clear Channel |
|
|
0 |
|
|
CIE-XYZ |
|
|
6 |
|
|
Normalized RGB |
|
|
4 |
|
|
Correlated Color Temperature [K] |
|
|
0 |
|
|
Intensity of Ambient Light [Lux] |
|
|
0 |
|
Normalized RGB
Normalized RGB ≠ sRGB (not equal to sRGB)
Sum of Normalized RGB channels is 255
You’re losing information - Only a raw estimation (see: https://aishack.in/tutorials/normalized-rgb/)
Example for Yellow ColorChecker Patch [Index No 16, sRGB(238 198 20)]:
Raw RGB (Range: 0..65535)      R   :                   3486.0
                               G   :                   2777.2
                               B   :                   1163.2
------------------------------------------------------------------
                               Sum :                   7426.4

Normalized RGB (Range: 0..1)   R   : 3486.0 / 7426.4 =    0.469406
                               G   : 2777.2 / 7426.4 =    0.373963
                               B   : 1163.2 / 7426.4 =    0.156630
------------------------------------------------------------------
                               Sum :                      1

Normalized RGB (Range: 0..255) R   : 0.469406 * 255  =  120
                               G   : 0.373963 * 255  =   95
                               B   : 0.156630 * 255  =   40
------------------------------------------------------------------
                               Sum :                    255
Compared to their corresponding sRGB values:
sRGB (Range: 0..255)           R   :                    238
                               G   :                    198
                               B   :                     20
------------------------------------------------------------------
                               Sum :                    456
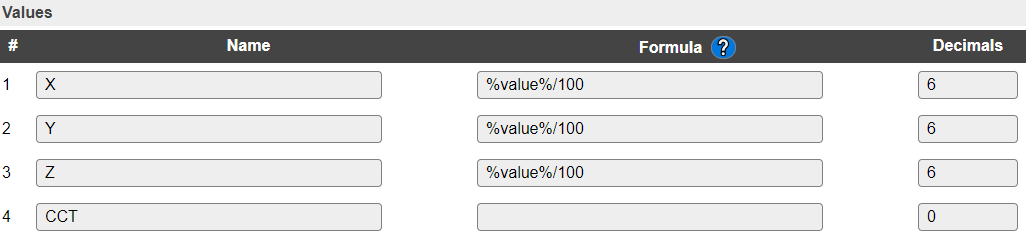
Adjust sensor’s values (precision)
Use 6 digit precision for the 3 color channels if additional transformations into other CIE Color or RGB standards are required.
Where to buy
Store |
Link |
|---|---|
adafruit |
$ = affiliate links which will give us some money to keep this project running, thank you for using those.
More pictures


Sensor calibration
General information
Below calibration method is following “ams Color Classification with the TCS230” (https://ams.com/documents/20143/80162/ColorSensors_AN000518_1-00.pdf).
Reference Measurements
Color charts/references such as the ColorChecker can be perfectly used for reference measurements.
Because of its wide availability and use, its careful design, its consistency and because comprehensive spectrophotometric measurements are available, the ColorChecker has also been used in academic research into topics such as spectral imaging:
https://xritephoto.com/documents/literature/en/ColorData-1p_EN.pdf
https://www.babelcolor.com/index_htm_files/ColorChecker_RGB_and_spectra.zip
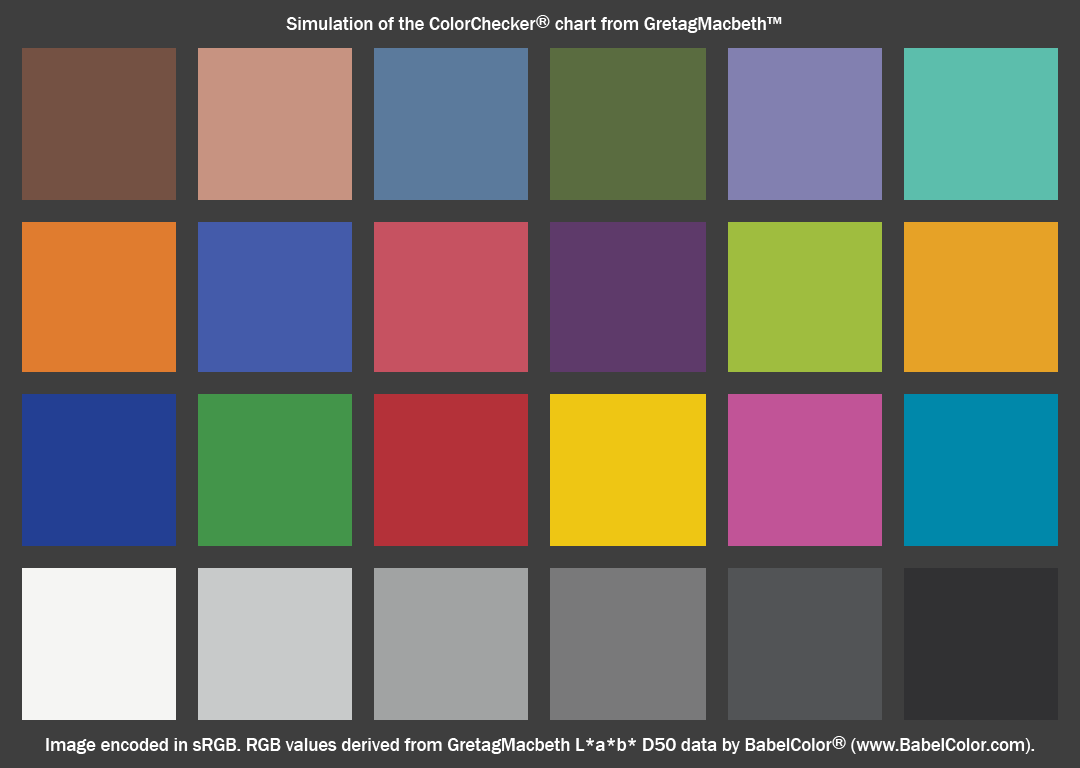
Above chart is converted from BabelColor: https://www.babelcolor.com/index_htm_files/ColorChecker_sRGB_from_Lab_D50.tif
Nominal chromaticities of ColorChecker patches in the CIE 1931 xy chromaticity diagram:

Conditions
Measurement under specific Light (Wavelength, Illuminance (lux), Color Temperature (CCT), Daylight, LED light, …)
Constant Distance between Light source <-> Object <-> Sensor
Constant Light Reflectance - Beam angel
Proper Gain and Integration Time settings
In case you illuminate via your LED monitor ensure proper monitor calibration first:
After applying transformation/calibration factors do NOT change your settings of Gain and Integration Time!
“White point” calibration - the most simple one
Good wikipedia article about color calibration (“Color balance”)
Illuminate a white paper with white/day light (please see above conditions) and measure sensor’s Normalized RGB values:
R'w = 77.4623
G'w = 90.4528
B'w = 87.0849
Calculate calibration factors for “White Point” [sRGB(255 255 255)]:
| R* |                | 255 / R’w     0               0               |               | R‘ |
| G* |        =       | 0             255 / G’w       0               |       *       | G‘ |
| B* |                | 0             0               255 / B’w       |               | B‘ |

cR' = 255 / R'w = 3.291924
cG' = 255 / G'w = 2.81915
cB' = 255 / B'w = 2.928177
But these factors obviously are ONLY for raw color estimations (see chapter “Normalized RGB”) …
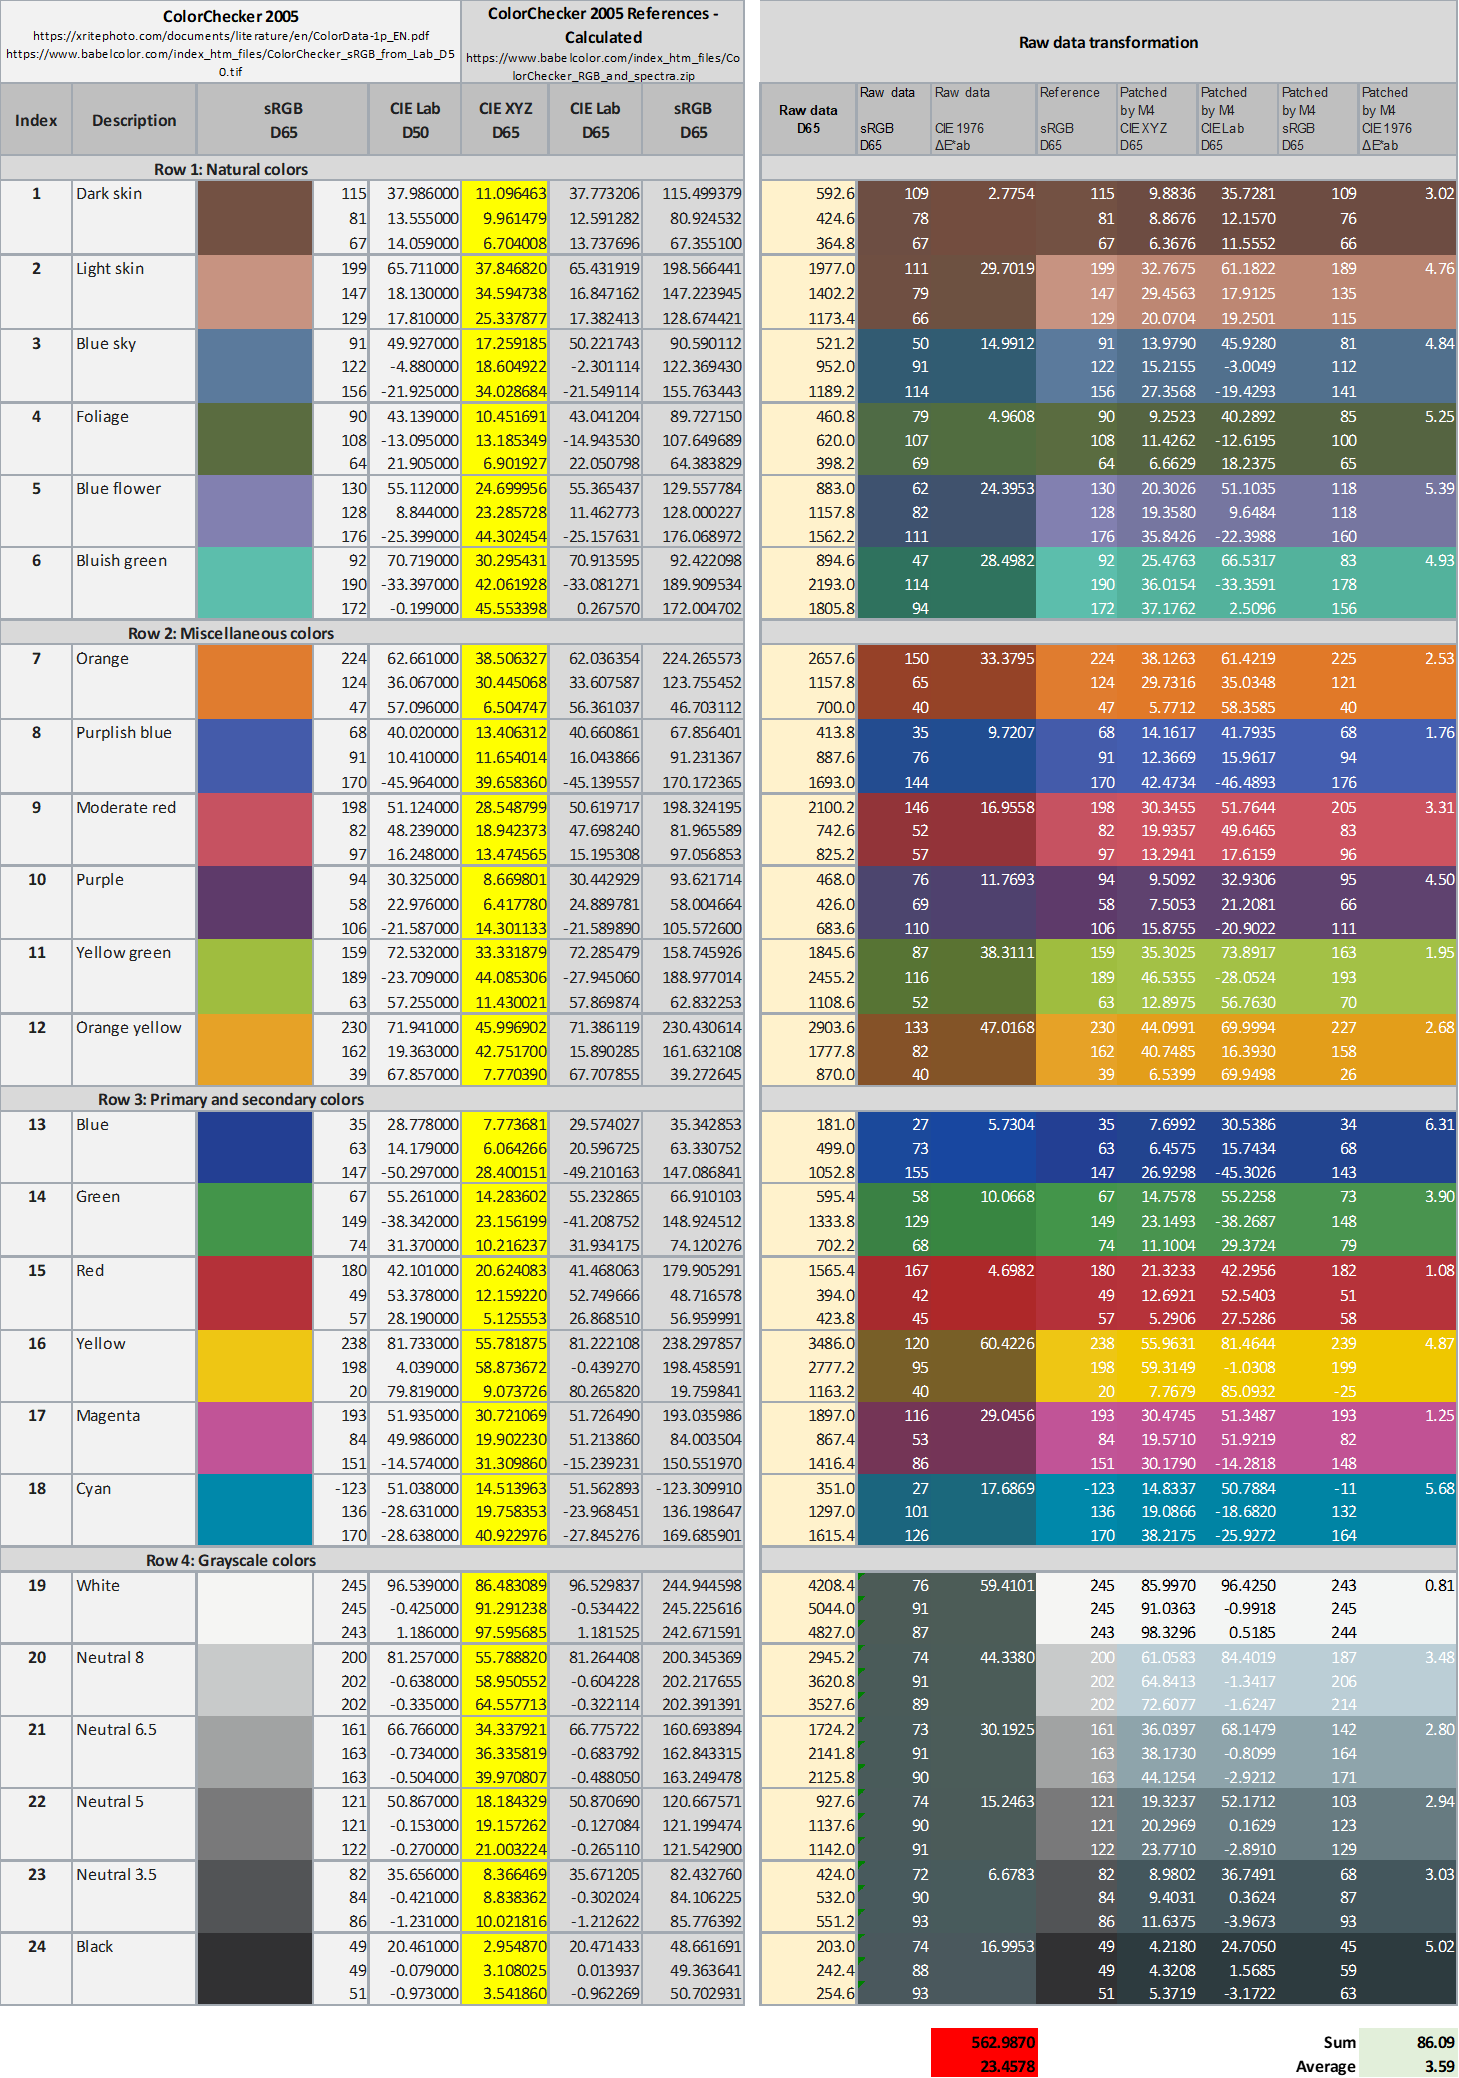
Mapping of sensor’s Raw RGB output channels to ColorChecker XYZ references
Most common and most accurate approach
Transformation matrix
                      | X"1   X"2     ...     X"n |           | R'1   R'2     ...     R'n |   -1
| M |         =       | Y"1   Y"2     ...     Y"n |   *       | G'1   G'2     ...     G'n |
                      | Z"1   Z"2     ...     Z"n |           | B'1   B'2     ...     B'n |

- X"[1-n], Y"[1-n] and Z"[1-n] are the CIE-XYZ reference values for ColorChecker Patches
- R'[1-n], G'[1-n] and B'[1-n] are the responses from the sensor's Raw RGB output channels
- | M | is the transformation matrix
To find the inverse matrix: https://comnuan.com/cmnn0100f/cmnn0100f.php
Based on above calibration measurements the transformation matrix looks like
                      |  0.011683      0.004073        0.003374 |
| M |         =       |  0.004609      0.016638       -0.002545 |
                      | -0.003017     -0.005424        0.028669 |
But be careful: Above transformation matrix is ONLY working for specific conditions (see chapter “Conditions).
You have to setup and to calculate a transformation matrix fitting to your specific need.
Transformation into CIE-XYZ color space
| X* |                                | R‘ |
| Y* |        =       | M |   *       | G‘ |
| Z* |                                | B‘ |

- X*, Y* and Z* are the estimated CIE-XYZ values
- R', G' and B' are the responses from the sensor's Raw RGB output channels
- | M | is above transformation matrix
Conversions from CIE-XYZ color space into other color spaces
Conversions from CIE-XYZ color space into RGB (e.g. sRGB, Adobe RGB (1998), …) or other color spaces are easyly to manage:
Conclusion
A average of 3.59 ΔE*ab (Max ΔE*ab: 6.31) between ColorChecker XYZ references and their corresponding estimated XYZ values is not so bad for an 7.95$ cheap sensor ;-)
References
Adafruit product page: https://www.adafruit.com/product/1334
ams TCS34725 product page: https://ams.com/tcs34725
ams TCS34725 data sheet: https://ams.com/documents/20143/36005/TCS3472_DS000390_3-00.pdf
Lux and CCT Calculations using ams Color Sensors (DN40): https://ams.com/documents/20143/36005/ColorSensors_AN000166_1-00.pdf
Calculating Color Temperature and Illuminance using ams Color Sensors (DN25): https://ams.com/documents/20143/36005/TCS34xx_AN000517_1-00.pdf
Improving Color Sensor Lux Accuracy using ams Color Sensors: https://ams.com/documents/20143/36005/ColorSensors_AN000261_1-00.pdf
ams Color Classification with the TCS230: https://ams.com/documents/20143/80162/ColorSensors_AN000518_1-00.pdf
ams Colorimetry Tutorial (DN 20): https://ams.com/documents/20143/36005/LightSensors_AN000519_1-00.pdf
X-Rite ColorChecker reference data (2009): https://xritephoto.com/documents/literature/en/ColorData-1p_EN.pdf
Descriptions and pictures of the ColorChecker: https://www.babelcolor.com/colorchecker.htm
CIE Color Calculator: http://www.brucelindbloom.com/index.html?ColorCalculator.html
CIE Color Difference Calculator: http://www.brucelindbloom.com/ColorDifferenceCalc.html
Useful Color Equations: http://www.brucelindbloom.com/index.html?Math.html
Change log
Changed in version 2.0: …
added Major overhaul for 2.0 release.
Added in version 1.0: …
added Initial release version.