Dust - PMSx003i (I2C)
.
Plugin details
Type: Dust
Port Type: I2C
Name: PMSx003i (I2C)
Status ESP32: CLIMATE B
Status ESP8266: .
GitHub: P175_PMSx003i.ino
Maintainer: .
Used libraries: .
Introduction
The Plantower PMSx003 modules are laser based particle sensors.
Particles are measured by blowing air through the enclosure with a laser inside. By measuring diffusion of the laser beam, the amount of particles is counted.
Measurement information is transmitted over a serial interface.
In opposition to the GP2Y10 this sensors have an own microprocessor that does reading and differing into the PM1.0, PM2.5 and PM10 sizes. The values can be read directly from the serial interface.
Units of Measure
Dust Particles
All supported Plantower PMSx003 modules can measure the concentration of dust particles, binned per size of the particle.
The measured values are either in counts per 0.1 liter, or in µg/m3.
To indicate the kind of particles that can be measured by the Plantower sensors:
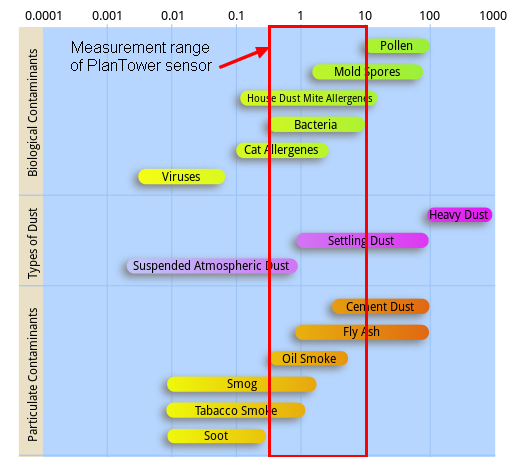
The counts per 0.1 liter can be specified in a larger number of bins. However, the Plantower particle sensors appear to be estimating particles larger than roughly 2.5 - 3 micron. The bins ranging from 0.3 … 2.5 micron are actually being measured, but the larger ones are estimates. This has as side effect that it may not show anything if there are no particles smaller than roughly 3 micron.
Conversion count/100ml to mg/m3
Conversion between counts per volume into weight per volume (e.g. mg/m3) is a bit more complicated than using a single multiplier factor. As can be seen in the particle size chart above, the average molecular weight of particles will be different per bin and also there is no such thing as an universal mixture ratio of particles all over the world.
There seem to be standardized conversion factors for:
PM10 consists of coarse particles that have diameters that are less than or equal to 10 micrometres
PM2.5 consists of fine particles with diameters less than or equal to 2.5 micrometres
PM1 (particles <= 1 micron)
However, a simple conversion rate is hard to find even though it seems to be standardized. What makes it even harder to perform such a conversion from counts per volume to weight per volume is the fact that the Plantower sensors count particles of a specific size and above.
For example:
PM2.5 is about particles less than or equal to 2.5 micrometres
cnt2.5/100ml indicates the number of particles with diameter beyond 2.5 micrometres in 0.1 L of air. (datasheet Plantower PMS5003)
Note
PMxx values relate to particles less than or equal to said size, while count/100ml relates to particles of at least said size.
Except when “Split count bins” is checked, then the “count/0.1L” values represent only a single bin.
Effects of Humidity
There are some reports suggesting that some particles may stick together causing a shift in the bins. For example, if one would draw a histogram of the counted particles per bin, the chart would appear to be shifted a bit to the more larger particles.
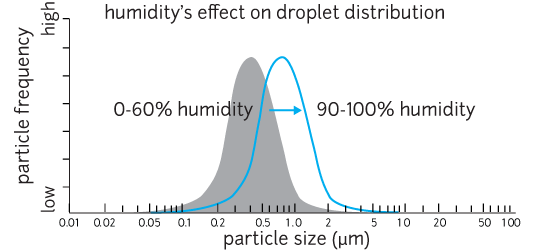
The apparent size shift vs. humidity is only for soluble particles. Water won’t adhere to insoluble particles, so high humidity won’t affect particle counts of soot, ash, or most dusts, but it will have an effect with salts (like sea salt spray) or organic compounds.
In some setups this may also make the counted values appear lower, since the sensor can only estimate the particles larger than 3 micron if there are also smaller particles detected. When the smaller particles all stick together thus no small particles will be observed by the sensor, the reading may be (much) lower than it actually should be. Try to have the sensor running in environments with relatively low humidity (less than 80%).
A very good video describing hazards of dust particles: Sabine Hossenfelder - How bad is Diesel?
Air Quality Index
There is a lot of information to be found online about the effects and health issues of exposure to dust particles. For example the UK guidelines of average daily exposure on Wikipedia:
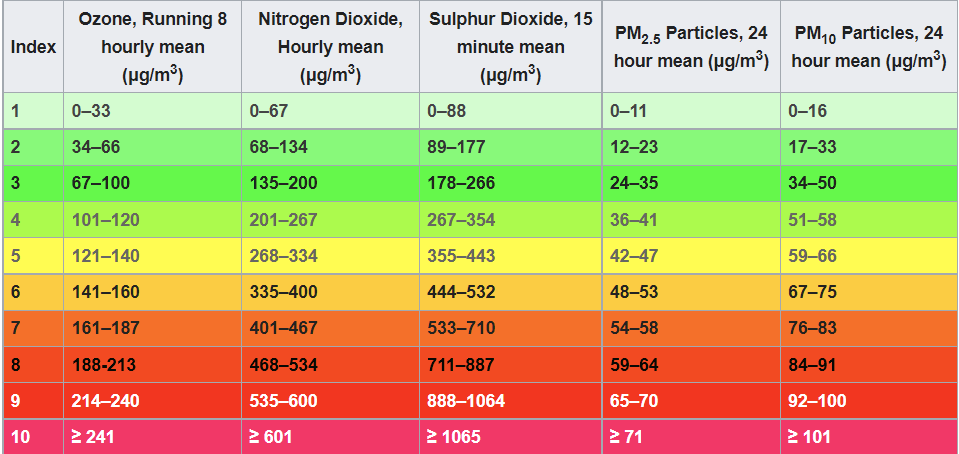
Source: Wikipedia - Air Quality Index
Such an Air Quality Index can then be used to indicate the maximum exposure (in days per year) which can be considered safe.
A website to check your local air quality: IQAir <https://www.iqair.com/>
Temperature/Humidity
Plantower sensors with T or ST in their model name, can also measure temperature and humidity.
It is likely that the modules capable of measuring humidity can also compensate for this humidity when calculating the concentration in µg/m3. However, so far it is unclear whether these sensors actually do compensate for this as humidity might cause the smaller particles to stick together. But this depends on the type of particles as not all may adhere to water, which makes it almost impossible to have a simple universal compensation factor for humidity.
It is up to the user to interpret (and correct) the data, as the user may have more information on the composition of the measured air.
Formaldehyde
Plantower sensors with S or ST in their model name, can also measure Formaldehyde.
When comparing concentration levels, one may encounter concentrations in ppm or µg/m3.
To compare these, use as conversion factor: 1 ppm = 1.25 mg/m3 (1 atm pressure, 20 degree C)
The Plantower sensors report the concentration in mg/m3.
The information below on Formaldehyde is an excerpt of the online found documents, written by WHO Regional Office for Europe, Copenhagen, Denmark, 2001
Formaldehyde is the most common aldehyde in the environment. The natural background concentration is < 1 µg/m3 with a mean of about 0.5 µg/m3.
In urban environments, outdoor air concentrations are more variable and depend on local conditions; annual averages are usually between 1 and 20 µg/m3.
Short-term peaks, e.g. in heavy traffic or during severe inversions, can range up to 100 µg/m3. (0.1 mg/m3) The levels of formaldehyde in indoor air are often higher than those in outdoor air. Major sources of formaldehyde in some dwellings are off-gassing of urea–formaldehyde foam insulation, particle board and formaldehyde-based resins. In the early 1980s, mean levels of 490 µg/m3 were measured in mobile homes, with individual measurements as high as several mg/m3 in new mobile homes. Now formaldehyde levels in mobile homes are typically around 100 µg/m3 or less. Mean levels in conventional homes with no urea–formaldehyde foam insulation range from 25 to 60 µg/m3
Exposure Guidelines
Formaldehyde has been shown to be toxic in higher concentrations. Concentration was more important than dose (concentration × length of exposure) in determining the cytotoxic effects of formaldehyde.
A short-term (30-minute) guideline of 0.1 mg/m3 is recommended as preventing sensory irritation in the general population.
A long-term exposure guideline of 0.21 mg/m3 for the protection of health for long-term effects, including cancer.
Source: WHO Guidelines for Indoor Air Quality: Selected Pollutants
Supported hardware
The supported Plantower device is the PMSA003i, as no other Plantower dust sensors using an I2C interface are currently available.
PMSA003i:

Precautions
The PMSx003 run on 5V. All inputs and outputs are TTL 3.3V compatible so no level converter is needed.
Some boards come with a sweep-up circuit to convert 3.3V to 5V, and can also be powered with 3.3V.
Pins:
VCC     - 5V (for fan and internal logic)
GND     - Ground (Note that chassis/case are ground also)
SDA/SCL - 3V3 I2C Data and clock signal
SET     - Standby function, when pulled down the module does not send information and goes into a low power state.
RESET   - Reset the module, similar to power-up, it takes ~30 seconds before data is received
Configuration

Name: A unique name should be entered here.
Enabled: The device can be disabled or enabled. When not enabled the device should not use any resources.
I2C options
The available I2C settings here depend on the build used. At least the Force Slow I2C speed option is available. This sensor can also be used with an I2C Multiplexer. For details see the I2C Bus page.
According to the documentation, the max. communication speed for this sensor is 100 kHz, the default Slow I2C speed setting, so this option is enabled by default.
Device Settings
GPIO -> RST(optional): The pin to control the Reset signal. Not used when set to None.
GPIO -> SET(optional): The pin to control the Active/Sleep state. Not used when set to None.
Device
Sensor model: Fixed value PMSA003i, not changeable at this time.
Output
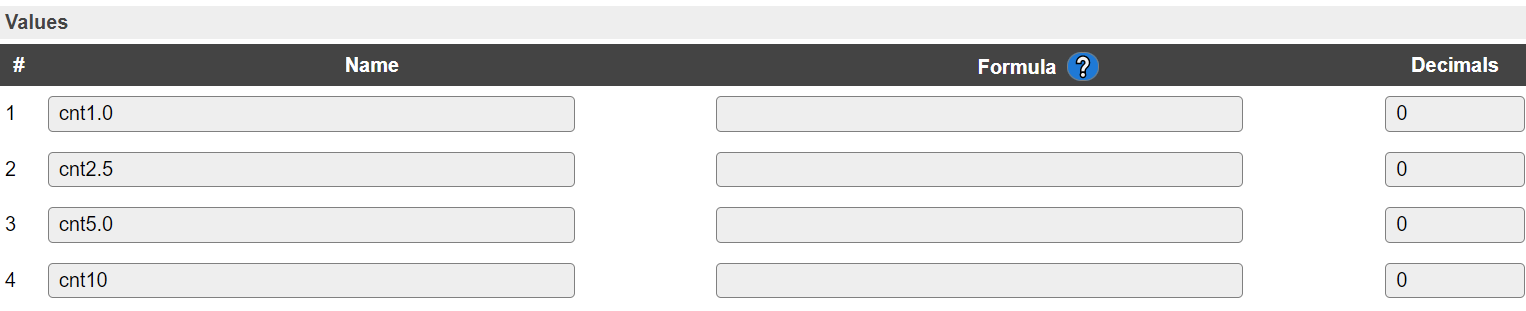
Output values
With PMSA003i extra output values are available. To choose which values are made available in the task, this combobox provides the available options.
Note
Changing this output selector will toggle a reload of the page. When the output selection has changed, the task value names will be reset to their (new) default names and the nr. of decimals will be set to proper values. (e.g. 1 decimal for temp/hum and 3 decimals for Formaldehyde) The nr of decimals will be set to at least 1 when oversampling is enabled.
Available options:
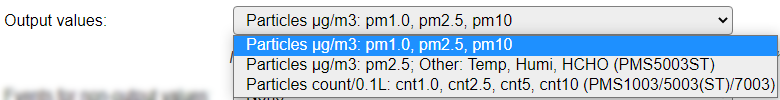
Particles µg/m3: pm1.0, pm2.5, pm10: The default output values, available for all supported sensors.
PM1.0- Concentration of particles < 1 micron (µg/m3)PM2.5- Concentration of particles < 2.5 micron (µg/m3)PM10- Concentration of particles < 10 micron (µg/m3)
Particles µg/m3: pm2.5; Other: Temp, Humi, HCHO (PMS5003ST): Particles > 2.5 micron (µg/m3) (only supported by the PMS5003ST sensor).
PM2.5- Concentration of particles < 2.5 micron (µg/m3)Temp- TemperatureHumi- HumidityHCHO- Formaldehyde concentration measurement (Formula: CH2O, or H-CHO)
Two choices for particle counts in count/0.1L (PMS1003/5003(ST)/7003/A003i) :
Particles count/0.1L: cnt1.0, cnt2.5, cnt5, cnt10:
Particles count/0.1L: cnt0.3, cnt0.5, cnt1.0, cnt2.5:
With:
cnt0.3- Count of particles > 0.3 micron per 0.1L of aircnt0.5- Count of particles > 0.5 micron per 0.1L of aircnt1.0- Count of particles > 1 micron per 0.1L of aircnt2.5- Count of particles > 2.5 micron per 0.1L of aircnt5- Count of particles > 5 micron per 0.1L of aircnt10- Count of particles > 10 micron per 0.1L of air
Note
PMxx values relate to particles less than or equal to said size, while count/100ml relates to particles of at least said size.
Except when “Split count bins” is checked, then the “count/0.1L” values represent only a single bin.
Events for non-output values
When an option other than None is selected, the Output values that are not directly available, will be sent via events. If there is some overlap in selected output values and the extra event selector, only those values which were not already sent as regular task values, will be sent in extra events.
Note
The “Single event with all values” option only combines the 4 selected task values in 1 event. Extra events will only contain 1 value per event.
Available options:
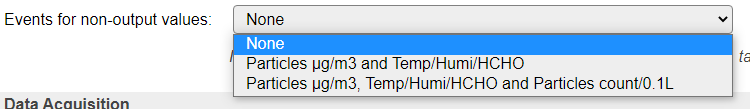
Particles µg/m3 and Temp/Humi/HCHO:
When Particles µg/m3: pm1.0, pm2.5, pm10 is selected: <Taskname>#Temp, <Taskname>#Humi and <Taskname>#HCHO, with the measured value available in %eventvalue1%. (Not available for PMSA003i)
When Particles µg/m3: pm2.5; Other: Temp, Humi, HCHO (PMS5003ST) is selected: <Taskname>#pm1.0 and <Taskname>#pm10.
Particles µg/m3, Temp/Humi/HCHO and Particles count/0.1L:
All of the above, and also <Taskname>#pm2.5, <Taskname>#cnt1.0, <Taskname>#cnt2.5 and <Taskname>#cnt10 events are generated if these are not selected as Output values.
These events can be used to store the values in a Dummy Device, so they can be sent out using a Controller, or they can be directly sent to an external system.
Example: (Sensor device using model PMSA003i and Dummy device named Particles with 2 values named pm1.0 and pm10)
On PMSA003i#pm1.0 do
  TaskValueSet,Particles,pm1.0,%eventvalue1%
Endon
On PMSA003i#pm10 do
  TaskValueSet,Particles,pm10,%eventvalue1%
Endon
These events will only be generated when the Rules option is enabled on the Tools/Advanced page.
Data Processing
The PMSx003 sensors may output samples quite often. Typically a sample is sent every 800 msec, with shorter intervals when the data does change a lot between readings. However, the sensor itself does not always have new data when a packet is sent by the sensor. These duplicate messages are detected and ignored.
Sensor init time after wake:
The Plantower datasheet suggests to let the sensor run for at least 30 seconds after power on (or wake up) to get a reliable reading.
When set to a value over 0 seconds, a timer will be set when the sensor is called to wakeup. During this period, any received sample will be ignored.
If running the sensor at an interval to save energy consumption and extend the sensors lifetime, make sure the “active” duration is longer than this sensor init time. The sensor typically needs 2.3 seconds to complete a measurement.
So a good duration for wake time is at least 35 - 40 seconds (oversampling enabled).
Oversampling:
By default, only the last sample is output by the task.
But since the counted values may change quite a lot between samples, it is advised to enable oversampling.
With oversampling enabled, the reported values are averaged over the period between calls of PLUGIN_READ (Interval).
This may give a more stable output value to process.
The default nr of decimals will be set to 1 when oversampling is enabled. (may require to switch the output values combo box)
Note
When putting the sensor to sleep, any collected data in the averaging buffer is flushed by scheduling a PLUGIN_READ. This will output the data to any connected controller and generate the appropriate events.
Any data still present in the buffer when waking the sensor is flushed, to make sure no old and new data is merged.
Split count bins:
The “count/0.1L” values are based on particles with at least the given size.
Thus a cnt0.3 value describes all particles with a size of at least 0.3 micron.
In some use cases it can be useful to count only the particles of a specific size, like 0.3 … 0.5 micron. When “Split count bins” is checked, the recorded counted values will be split over single bins.
Lifetime Helper
The laser diode inside the PMSx003 has a lifetime of about 8000 h, nearly one year. With the actual plugin the sensor is powered permanently so we have to take some care about this.
wake/sleep command
Using the pmsx003,sleep and pmsx003,wake commands can be used to reduce the energy consumption and extend the laser lifetime.
Example rules:
On System#Boot do    //When the ESP boots, do
  looptimerset,1,300  // Start loop timer 1, 300 sec interval
  timerSet,2,30 // Set timer 2 to put the sensor to sleep again
endon

On Rules#Timer=1 do
  timerSet,2,30 // Set timer 2 to put the sensor to sleep again
  pmsx003,wake
endon

On Rules#Timer=2 do
  pmsx003,sleep
endon
In the example setup, a GPIO pin should be connected to the SET input of the PMSA003i. If it is pulled low the sensor sleeps. The wake and sleep commands change the state of the configured GPIO pin accordingly.
Unlike the serial connected PMSx003 sensors, no sleep/wake command can be sent to the sensor, so sleep/wake can only be achieved by using the SET pin.
Data Acquisition
This group of settings are standard available configuration items.
Single event with all values: When this setting is enabled, all available values will be sent in a single event
<TaskName>#All, with all values in order as arguments to the event.Show derived values: When checked, the Devices overview page, and the
/jsonendpoint (used for updating the Devices overview page) will include any Derived values as defined. See theTaskValueSetDerivedandTaskValueSetPresentationcommands.Event & Log derived values: When checked, the Derived values will be generated as Events, to be handled in Rules, and sent to logging devices like the Syslog server and/or SD-card logging.
(The derived values options are only available if String variables feature is included in the build.)
Send to Controller: Select the Controller(s) to send the Values to, either on a
TaskRuncommand applied to the task, or on an Interval time action.
Send to Controller is only visible when one or more Controllers are configured.
Depending on the controller capabilities, some configuration settings may be shown:

All configured Controllers are shown here, including the enabled or disabled state (multiple Controllers can be enabled, only a single MQTT Controller can be enabled at one time!).
For each controller the user can select wether the data should be sent on each Interval (or explicit TaskRun).
For the Domoticz controllers the value index (IDX) has to be configured.
For some controllers, like Home Assistant/openHAB, there are extra options available.
Group: This represents the group id to combine all values from multiple tasks into a single grouped-device during MQTT AutoDiscovery. Groups, by design, can span multiple ESPEasy devices, if desired, as long as the Task/Valuename combinations are unique. If a group should only combine Tasks from a single ESPEasy unit, the group id should be unique across multiple ESPEasy units. The group description, default Group <n>, can be adjusted in Home Assistant. If the Group value matches the current Unit nr, the Unit name,
%sysname%, is used instead of Group <nr>.Retained: For MQTT Controllers, this setting can be enabled to send the values for the current task with the Retain flag set. The Publish Retain flag in the Controller settings will override this by sending all task values with Retain flag enabled.
Send derived: This checkbox determines if any configured Derived values should also be sent to the controller (and included in the AutoDiscovery if that’s available and enabled).
Resend MQTT Discovery: When checked, will start a resend of the MQTT Discovery process for this task after a random delay, when Submit is clicked, so any changed settings will be updated in the MQTT broker. This setting is only available if the controller is enabled, the Auto Discovery feature is available and enabled for the controller. This setting is not stored.
Other controllers, like f.e. FHEM HTTP, do not support additional settings besides the checkbox to enable sending the data.
Commands available
Command |
Extra information |
|---|---|
|
Pulls the |
|
Pulls the |
|
If the |
Events
A task running the PMSx003 can be configured to output a number of values as standard task values. However the sensor outputs more values than can be used as ESPEasy task values.
To overcome this limitation, one can set what other measured values can be useful to have as an event for processing in the rules.
Which of the following events may be sent, depends on this setting and also whether the sensor is capable of measuring the described unit of measure.
Event |
Example |
|---|---|
A task named |
on foo#Humi do
  if %eventvalue1% > 90
    GPIO,2,1 //LED on
  else
    GPIO,2,0 //LED off
  endif
endon
|
A task named |
on foo#HCHO do
  if %eventvalue1% > 0.1
    GPIO,2,1 //LED on
  else
    GPIO,2,0 //LED off
  endif
endon
|
A task named |
on foo#cnt1.0 do
  if %eventvalue1% > 300
    GPIO,2,1 //LED on
  else
    GPIO,2,0 //LED off
  endif
endon
|
A task named |
on foo#pm1.0 do
  if %eventvalue1% > 300
    GPIO,2,1 //LED on
  else
    GPIO,2,0 //LED off
  endif
endon
|
Note
PMxx values relate to particles less than or equal to said size, while count/100ml relates to particles of at least said size.
Except when “Split count bins” is checked, then the “count/0.1L” values represent only a single bin.
Change log
Added in version 2.0: …
added 2024-10-12 Initial release version.